
Visualize Data
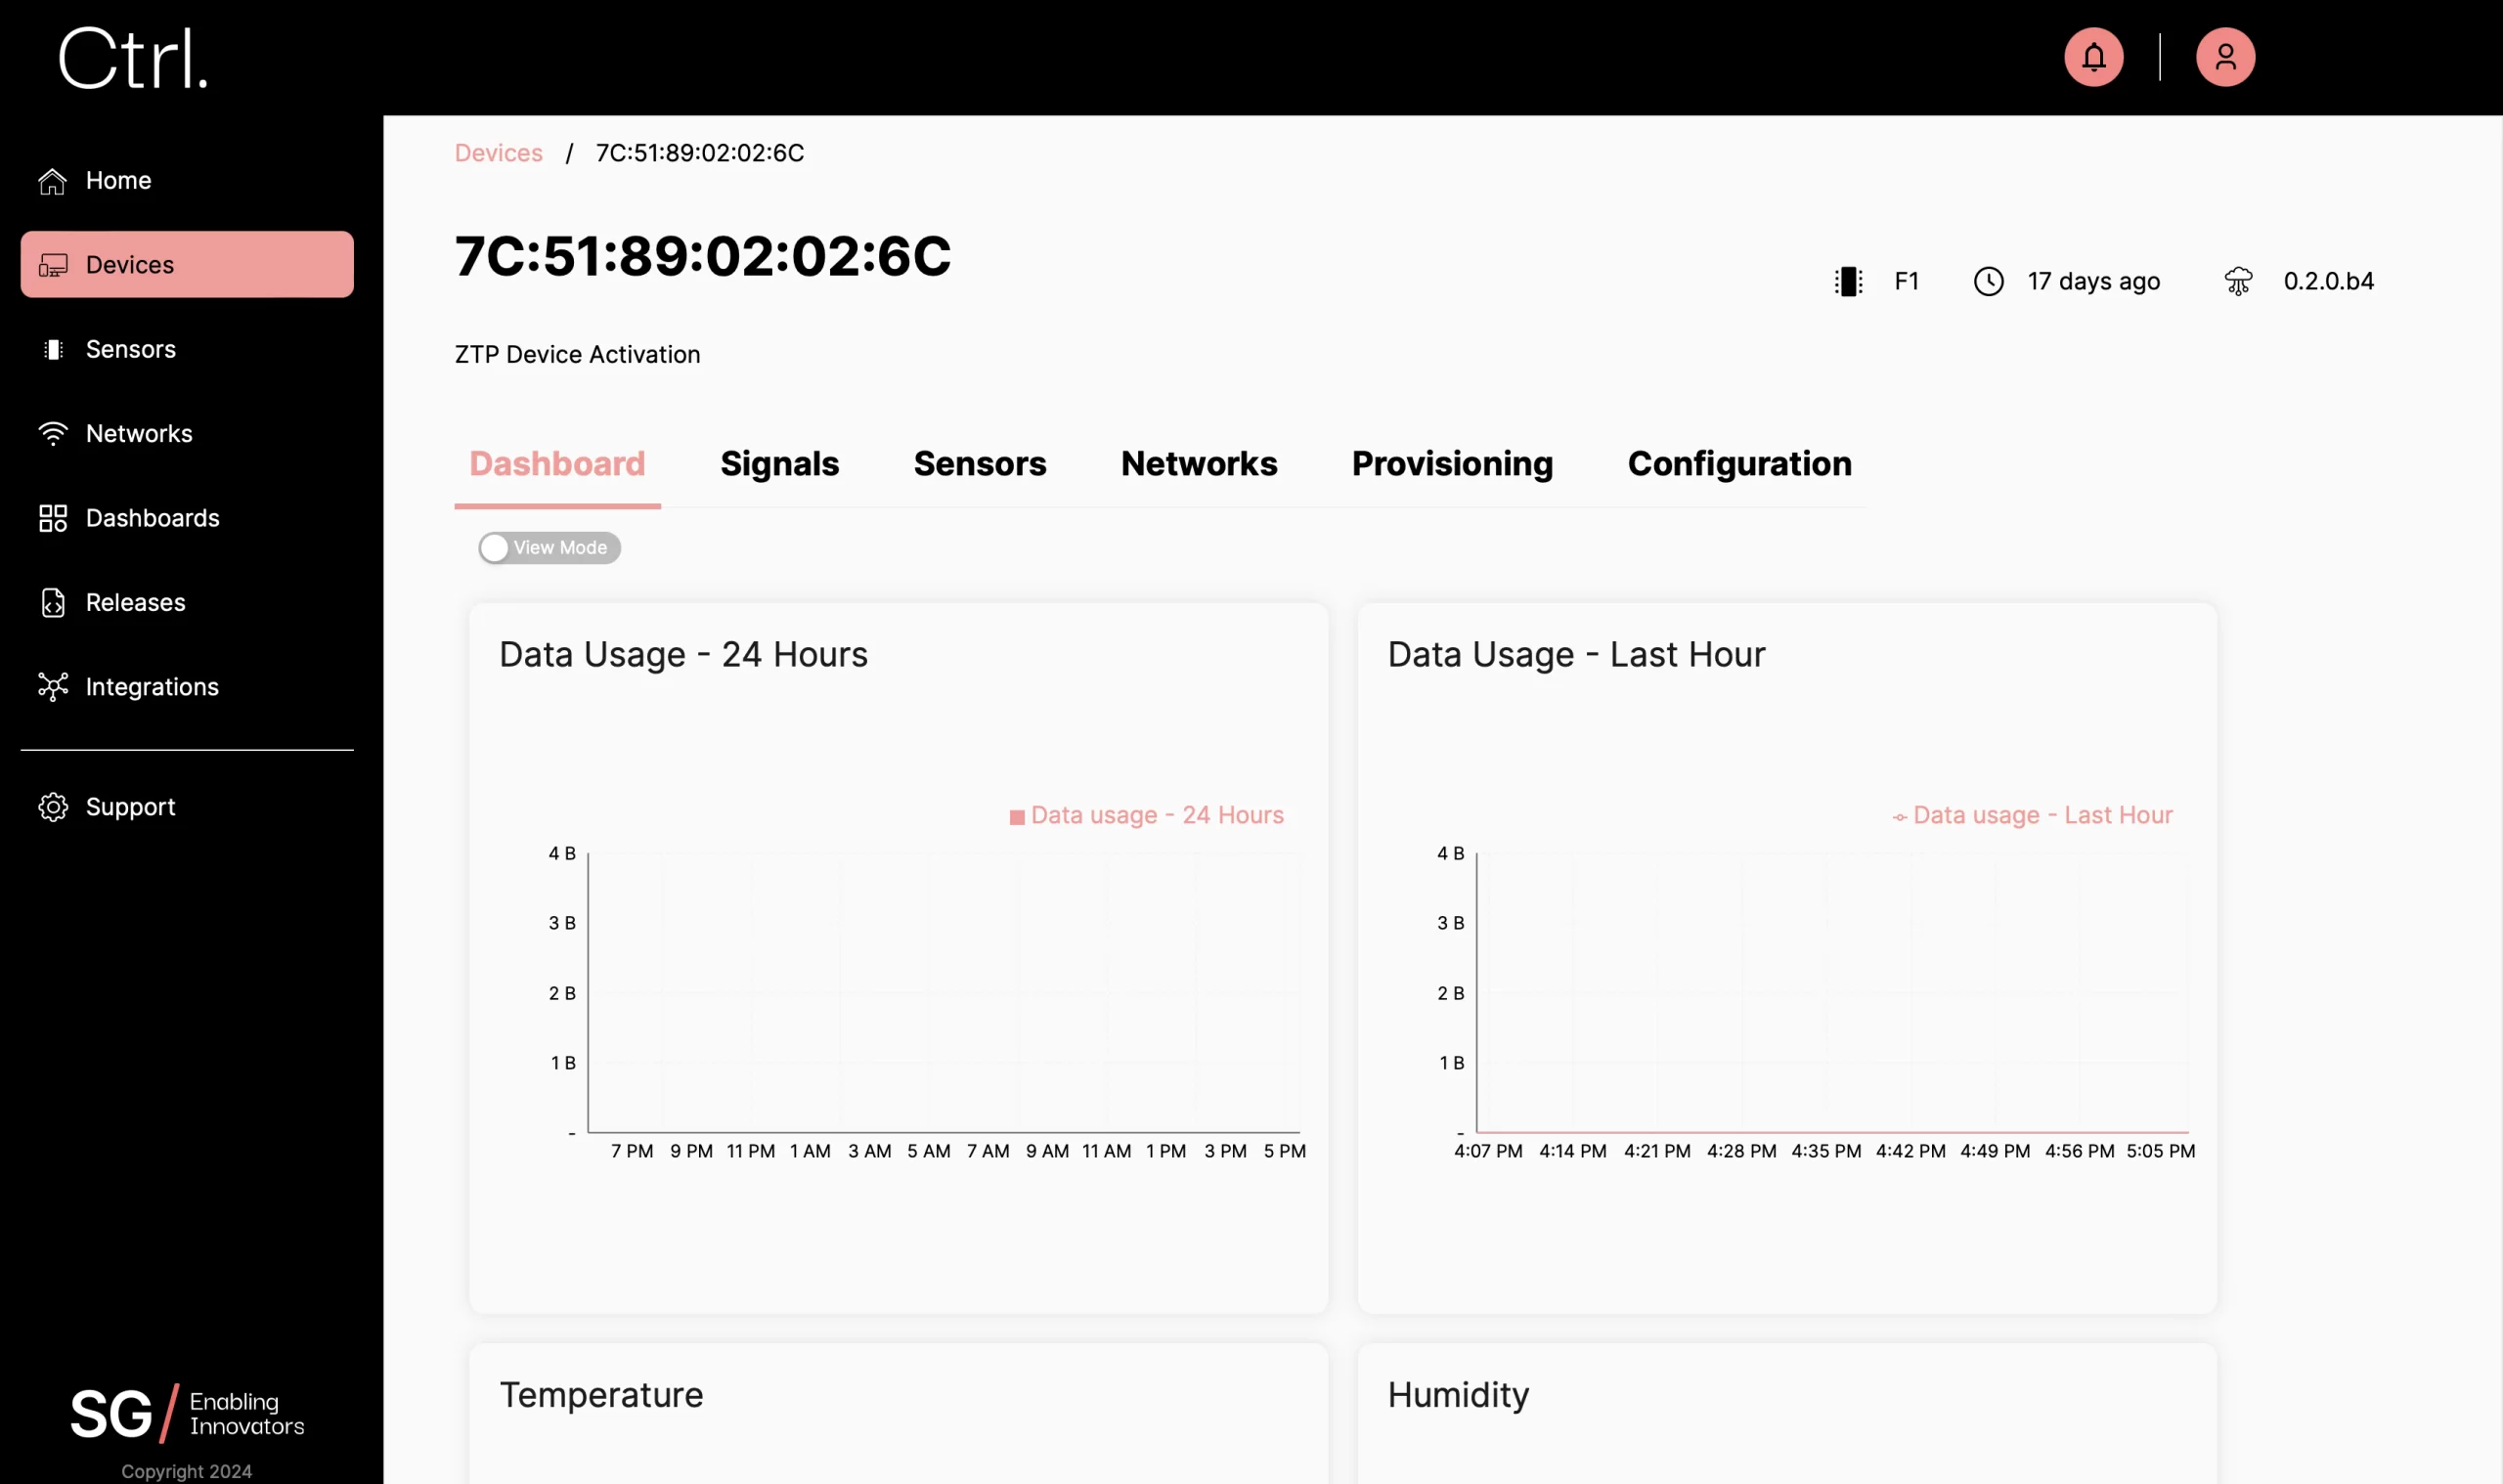
By default, two line charts have been created for you. These show data usage for the last hour and the past 24 hours. In this section, we will explain how to see the data coming from your device on Ctrl.
Note
We’re assuming that you have already connected your device to Ctrl. In case you haven’t, check how to add your device. After you’re done with that, you can proceed to the next example.
Step 1: Set up a CtrlR Project
Create a project in CtrlR called CtrlR_signals, and add the following code to
main.py. This Python application will send data every 10 seconds to Ctrl.
import time
import math

# Send data continuously to Ctrl
while True:
    for i in range(0, 20):
        ctrl.send_signal(1, math.sin(i / 10 * math.pi))
        print('sent signal {}'.format(i))
        time.sleep(10)
Press the Upload button to upload the code into your device.
Step 2: Monitor a signal from your device
Go to the Ctrl device page and select your device.
Then go to the
Signalstab and view signals received.Select a signal number to view message history.
Done!
Now you’ve learned how to view your data on the device.